Home>Articles>Which Weather Instrument Is Used To Measure Air Temperatures Recorded On A Weather Map?
Articles
Which Weather Instrument Is Used To Measure Air Temperatures Recorded On A Weather Map?
Modified: December 7, 2023
Learn about the weather instrument used to measure air temperatures recorded on a weather map. Read our informative articles and gain insights into this fascinating topic.
(Many of the links in this article redirect to a specific reviewed product. Your purchase of these products through affiliate links helps to generate commission for Storables.com, at no extra cost. Learn more)
Introduction
In the world of meteorology, weather maps are crucial tools used to monitor and understand the ever-changing atmospheric conditions. These maps provide valuable information about various weather parameters such as air pressure, wind direction, and precipitation. One key element that is recorded on a weather map is air temperature, as it plays a significant role in determining weather patterns and forecasting.
Measuring air temperature accurately and precisely is essential for meteorologists to analyze and predict weather conditions accurately. In this article, we will explore the importance of measuring air temperatures on a weather map and the specific instrument used in this process.
By understanding the significance of air temperature measurements and the instrument used, we can gain a greater appreciation for the science behind weather forecasting and how it impacts our daily lives. So, let us dive deeper into the world of meteorology and explore the instrument used to measure air temperatures recorded on a weather map.
Key Takeaways:
- Thermometers, including mercury-filled, digital, and infrared types, are crucial instruments used to measure air temperatures on weather maps. They play a vital role in providing accurate and reliable temperature data for weather analysis and forecasting.
- Visual representations such as contour lines, color coding, and weather station symbols are used to record air temperatures on weather maps. These representations help meteorologists analyze temperature patterns and make accurate weather forecasts.
Understanding air temperatures on a weather map
When looking at a weather map, air temperatures are represented by various symbols and colors to indicate different temperature ranges. These temperature values provide valuable insights into the current weather conditions across a particular region.
Air temperature is a measure of how hot or cold the air is at a specific location. It is typically measured in degrees Celsius (°C) or Fahrenheit (°F). The temperature recorded on a weather map helps meteorologists identify and analyze weather patterns, such as cold fronts, warm fronts, and areas of high or low pressure.
By examining the distribution of temperatures on a weather map, meteorologists can determine the boundaries between different air masses. These boundaries, known as fronts, are crucial for understanding weather patterns and predicting how they will evolve over time.
Understanding air temperatures on a weather map involves interpreting the values displayed and identifying any significant temperature gradients or variations. These temperature variations can indicate the presence of weather systems, such as thunderstorms, heatwaves, or cold snaps.
Furthermore, air temperature information on a weather map is not limited to the present moment. Historical temperature data can be used to analyze climate trends, study long-term temperature changes, and monitor the impact of climate change on different regions.
In summary, air temperatures on a weather map provide essential information for meteorologists to understand current weather conditions, identify weather systems, and predict future weather patterns. By analyzing temperature data, meteorologists can make more accurate and informed decisions regarding weather forecasting and warning systems.
Importance of measuring air temperatures
Measuring air temperatures is of utmost importance in meteorology and weather forecasting. It provides valuable information that helps meteorologists analyze weather patterns, understand climate trends, and make accurate predictions. Here are some key reasons why measuring air temperatures is crucial:
- Weather forecasting: Air temperatures play a vital role in determining weather conditions. By measuring and monitoring the temperature changes in various regions, meteorologists can accurately predict weather patterns, identify the potential for storms or severe weather events, and issue timely warnings to the public.
- Climate analysis: By collecting long-term temperature data, meteorologists and climatologists can analyze climate trends and patterns. This data helps in the study of climate change, identifying shifts in temperature averages, and understanding the impact of human activities on global temperatures.
- Understanding weather systems: Air temperature variations provide valuable insights into the formation and movement of weather systems such as fronts, low-pressure systems, and high-pressure systems. These temperature changes help meteorologists identify areas of potential instability or the development of severe weather phenomena like tornadoes or hurricanes.
- Hydrological forecasting: Measuring air temperatures also assists in hydrological forecasting, which involves predicting changes in water availability, streamflow, and water resource management. Temperature data is particularly crucial in determining snowmelt rates, which has implications for flood control, irrigation, and water supply systems.
- Agriculture and farming: Monitoring air temperatures is essential for farmers and agricultural communities. They rely on temperature data to make decisions about when to plant crops, protect crops from frost, and manage irrigation practices effectively.
Without accurate and reliable measurements of air temperatures, meteorologists would struggle to understand weather patterns, predict extreme events, and provide valuable information for public safety and planning. Measuring air temperatures is therefore a fundamental aspect of meteorology and plays a vital role in our day-to-day lives.
Weather instrument used to measure air temperatures
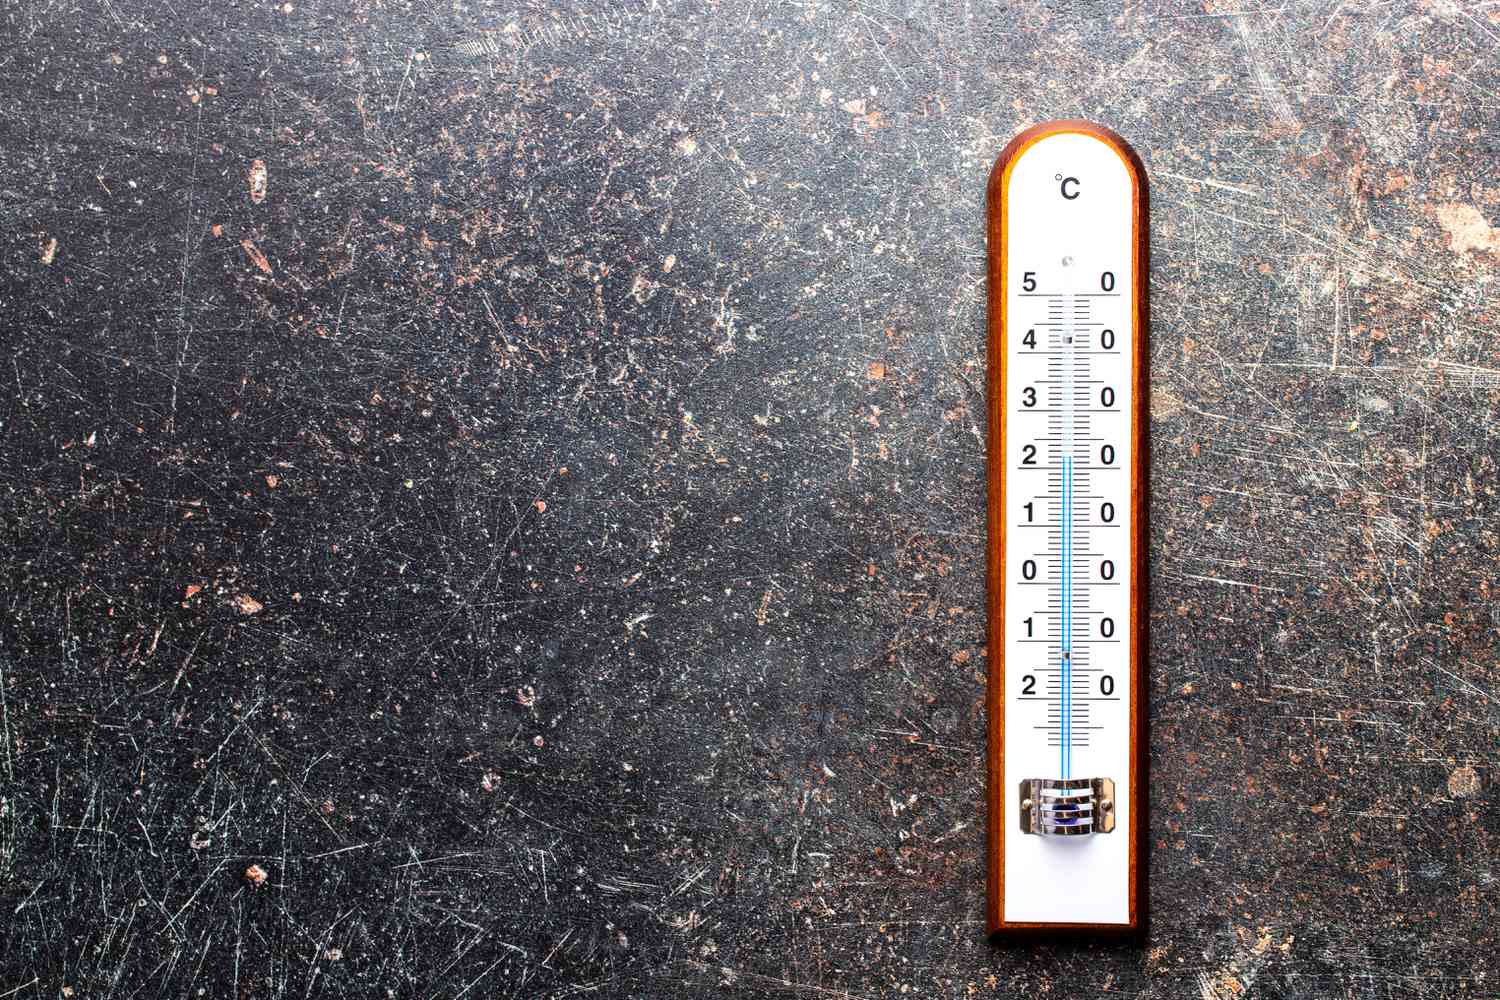
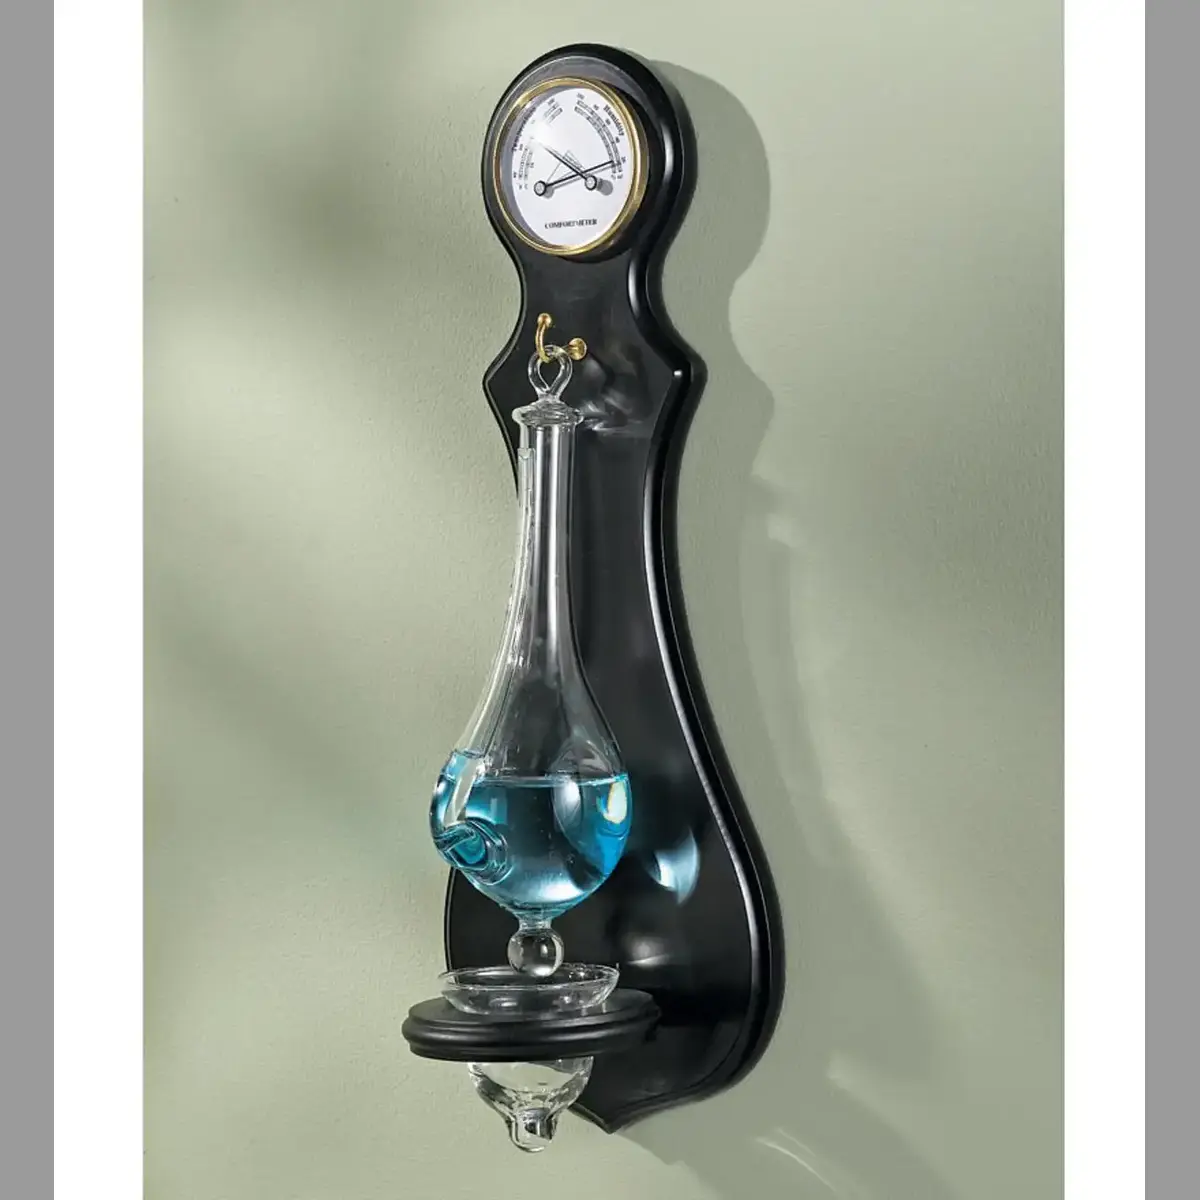
The primary instrument used to measure air temperatures is known as a thermometer. A thermometer is a device specifically designed to measure and display temperature accurately. It consists of a narrow, sealed glass tube containing a liquid (usually mercury or alcohol) that expands or contracts based on changes in temperature.
There are various types of thermometers used for measuring air temperatures, each with its specific purpose and method of temperature sensing. Some common types include:
- Mercury-filled thermometers: These thermometers use mercury as the temperature-sensitive liquid. The mercury expands or contracts when exposed to temperature changes, causing it to move up or down the marked scale. They are widely used for precise and reliable temperature measurements.
- Alcohol-filled thermometers: Instead of mercury, these thermometers use alcohol as the temperature-sensitive liquid. Alcohol thermometers are commonly used in environments where mercury is not preferred, such as in medical applications.
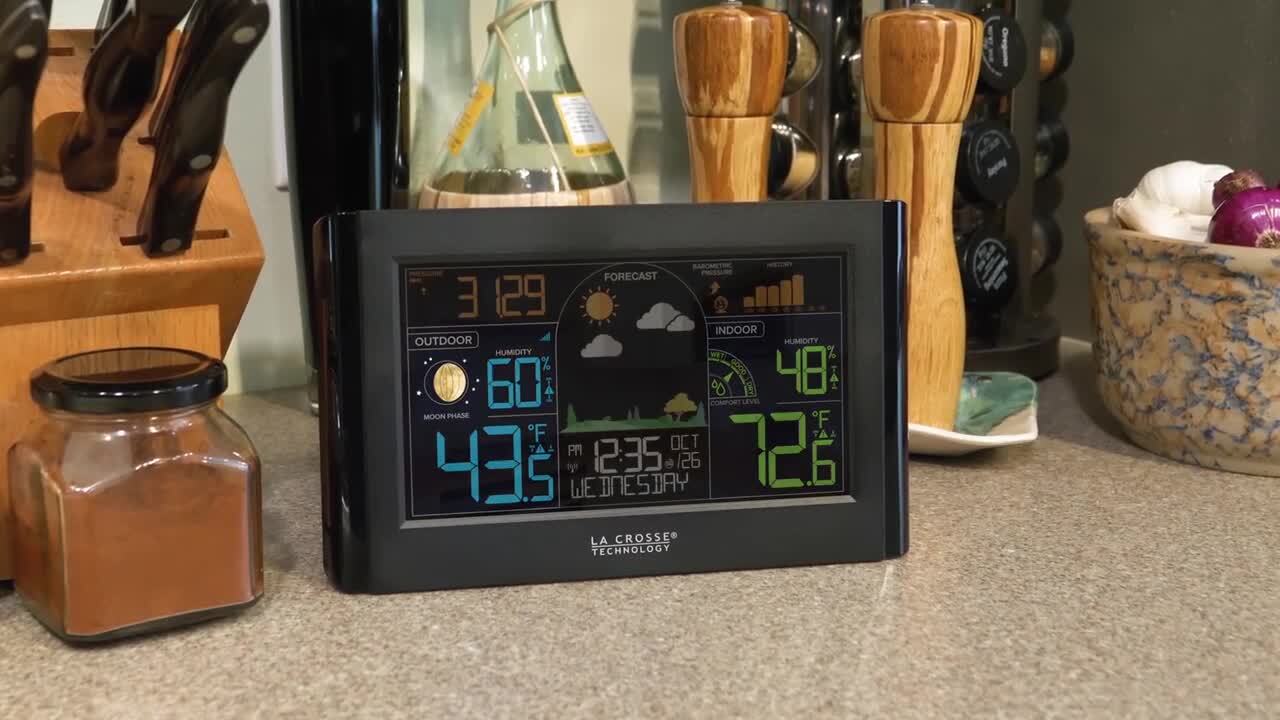
- Digital thermometers: Digital thermometers use electronic sensors to measure temperature and display the readings digitally. They provide quick and accurate temperature measurements and are widely used in various fields, including meteorology.
- Infrared thermometers: Infrared thermometers measure temperature without physically contacting the object or air being measured. They detect infrared radiation emitted by an object and convert it into temperature readings. Infrared thermometers are often used in situations where non-contact temperature measurements are required.
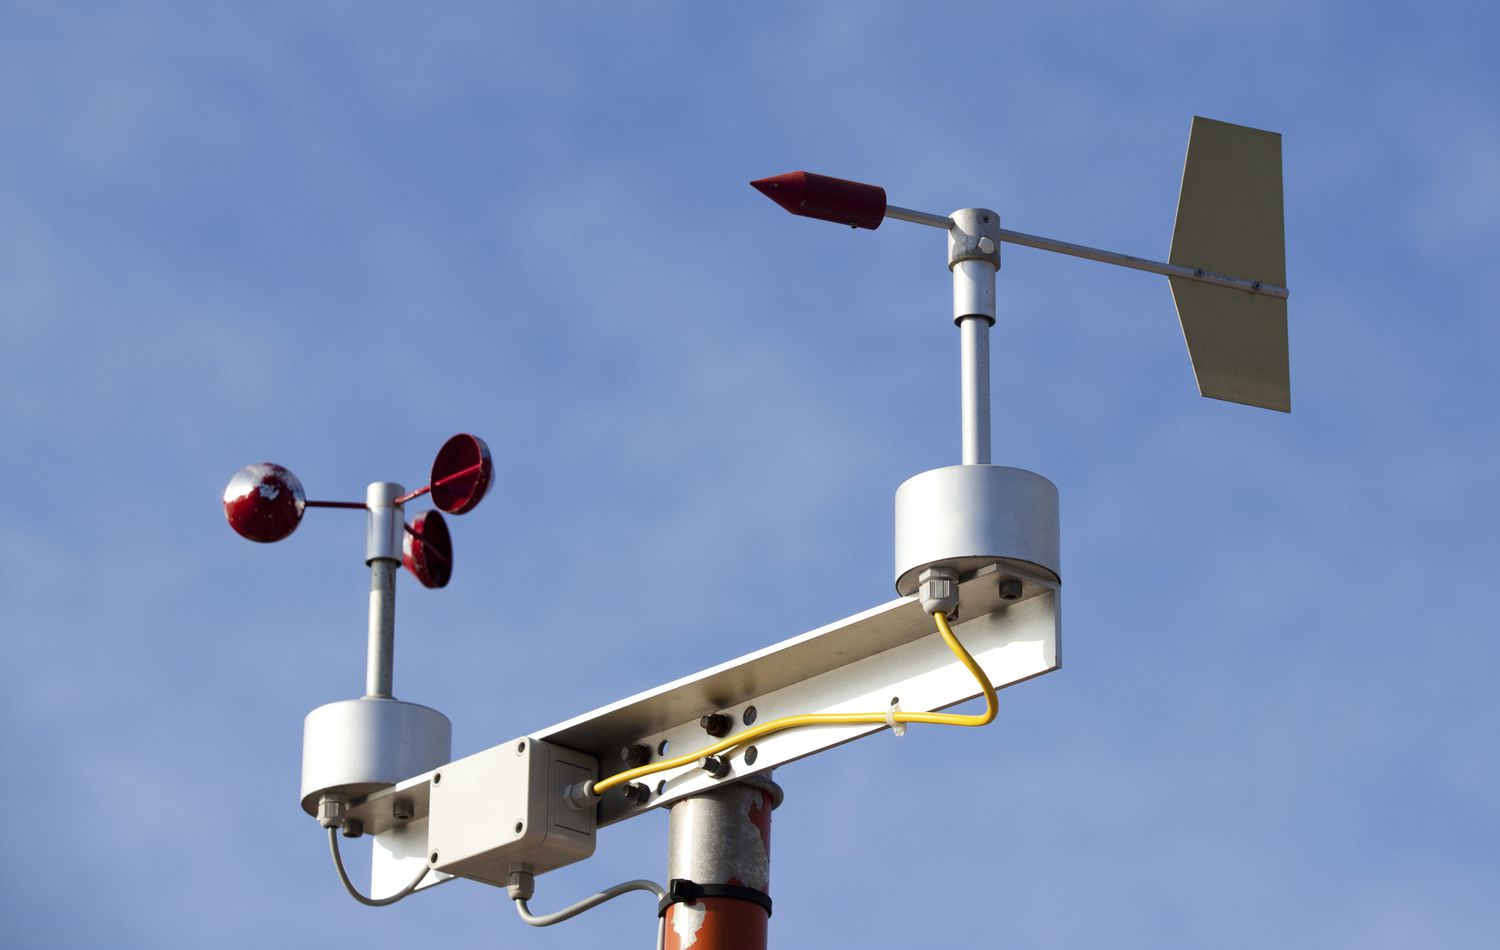
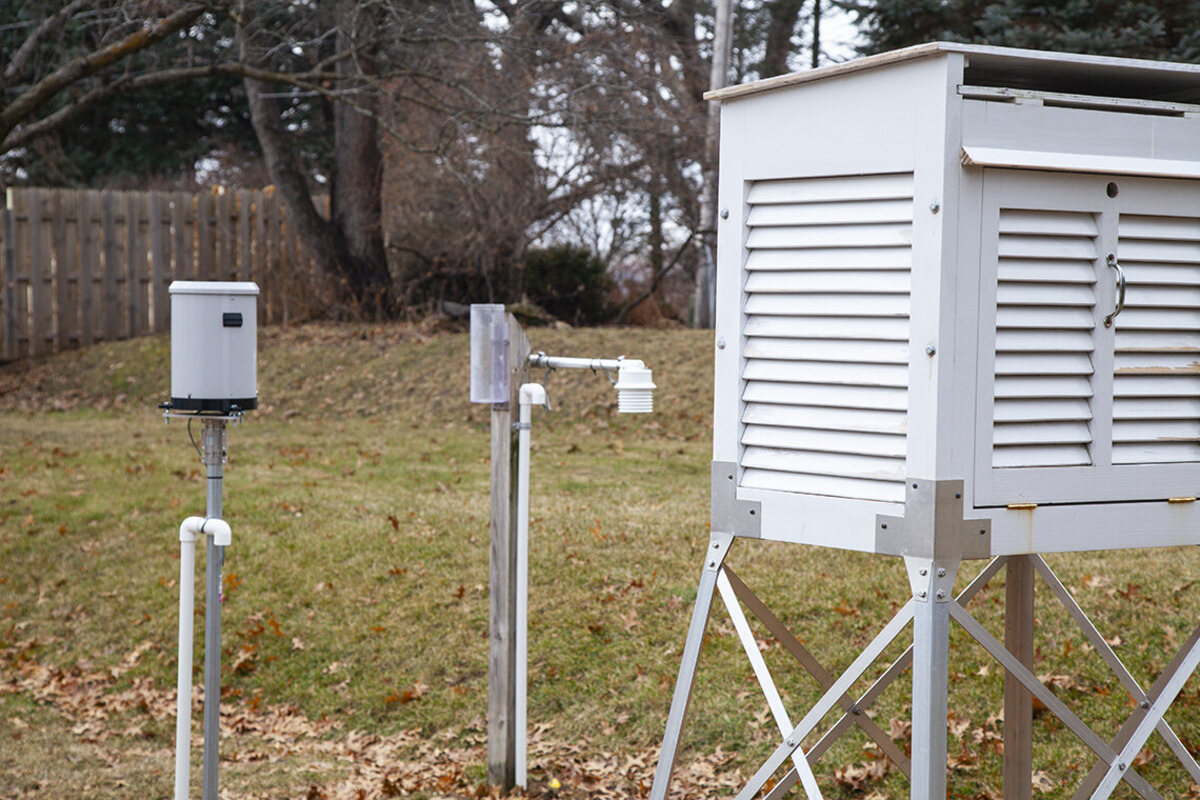
- Weather stations: Weather stations use a combination of sensors, including thermometers, to measure various weather parameters. These stations can be automated and provide real-time temperature readings, along with other weather data such as humidity, wind speed, and rainfall.
The type of thermometer used depends on the specific application and requirements. In meteorology, mercury-filled or digital thermometers are commonly used for measuring air temperatures. These thermometers are carefully calibrated to ensure accurate readings and are placed in suitable locations to minimize any potential influences that could affect temperature measurement, such as direct sunlight or heat radiating from nearby objects.
It is worth mentioning that technological advancements in meteorology have led to the development of more sophisticated and remotely operated temperature-sensing devices. However, the fundamental principle of using thermometers for measuring air temperatures remains unchanged.
Overall, the thermometer is the primary instrument used to measure air temperatures and plays a critical role in providing accurate temperature data for weather analysis, forecasting, and other scientific applications.
A thermometer is used to measure air temperatures recorded on a weather map. It is important to place the thermometer in a shaded area to get an accurate reading.
How the instrument works
The working principle of a thermometer is based on the concept of thermal expansion. When a substance is heated, its molecules gain energy and move more vigorously. This increased molecular motion causes the substance to expand, resulting in an increase in volume. Conversely, when a substance is cooled, its molecules lose energy, move less vigorously, and contract, leading to a decrease in volume.
In the case of a traditional mercury or alcohol thermometer, the liquid inside the sealed glass tube expands or contracts in response to changes in temperature. The thermometer consists of a narrow capillary tube with a bulb at one end that contains the liquid. The bulb is usually exposed to the surrounding air or surface whose temperature needs to be measured.
As the temperature increases, the heat is transferred to the liquid inside the bulb. The liquid molecules gain energy and move more rapidly, causing them to collide with each other and the walls of the capillary tube. This increased molecular motion results in the liquid expanding and moving up the tube.
Conversely, when the temperature decreases, the liquid loses heat energy, and the molecular motion slows down. As a result, the liquid contracts, causing it to move down the tube. By marking the scale on the glass tube, the change in position of the liquid can be observed and used to determine the corresponding temperature reading.
Digital thermometers, on the other hand, work differently. They use electronic sensors, such as thermistors or resistance temperature detectors (RTDs), to measure temperature. These sensors detect changes in electric resistance or other electrical properties that occur as a result of temperature variations. The resistance or electrical signal is then converted into a digital display to provide the temperature reading.
Infrared thermometers work by detecting and measuring the infrared radiation emitted by an object. They contain a lens system that focuses the infrared radiation onto a detector. The detector converts the radiation into an electrical signal, which is then processed to determine the temperature of the object.
Regardless of the type of thermometer used, it is important to calibrate the instrument regularly to ensure accuracy. Calibration involves comparing the thermometer readings with known reference temperatures and making necessary adjustments if any discrepancies are found.
In summary, thermometers work based on the principle of thermal expansion or the detection of infrared radiation. Whether it is the expansion and contraction of a liquid in a traditional thermometer or the measurements obtained through electronic sensors or infrared detection, the goal is to provide accurate and reliable temperature readings in various applications, including meteorology.
Recording air temperatures on a weather map
Recording air temperatures on a weather map involves translating the measured temperature values into visual representations that can be easily understood and analyzed. Meteorologists use various symbols and colors to depict air temperatures on weather maps, allowing them to visualize temperature patterns across a specific region.
One common method used to represent air temperatures is through the use of contour lines. Contour lines connect points of equal temperature on a map, forming a pattern that resembles a topographic map. Meteorologists draw contour lines to represent specific temperature intervals, such as every 5 or 10 degrees Celsius, to provide a clear visualization of the temperature distribution.
To enhance the readability of the weather map, meteorologists may incorporate color coding alongside the contour lines. They assign different colors to different temperature ranges, such as blue for cooler temperatures, red for warmer temperatures, and shades in-between for intermediate temperatures. This color scheme helps observers quickly identify temperature patterns across the map.
In addition to contour lines and color coding, meteorologists may use numerical temperature values to provide precise information. They may place temperature labels at specific locations on the weather map, indicating the exact temperature recorded at that particular spot. These labels help users to obtain accurate temperature readings for a specific location.
Another method of recording air temperatures on a weather map is through the use of weather station symbols. Weather stations are equipped with thermometers that continuously monitor and transmit temperature data. These stations are represented on the weather map by unique symbols, which often include a combination of numbers and temperature icons.
For example, a weather station symbol might consist of a numerical temperature value, such as 25°C, placed alongside a small icon of a thermometer. This symbol provides both the temperature reading and its location on the map, allowing meteorologists to gather valuable data from multiple stations across the region.
Furthermore, modern technology has enabled the integration of real-time temperature data from automated weather stations and remote sensing instruments into weather maps. These advanced sensors provide up-to-date temperature information, which is then displayed on the map in near real-time.
Overall, recording air temperatures on a weather map involves utilizing contour lines, color coding, numerical values, and weather station symbols to represent temperature patterns across a specific region. These visual representations provide valuable information to meteorologists, helping them analyze weather patterns, identify temperature gradients, and make accurate weather forecasts.
Conclusion
Measuring and recording air temperatures on a weather map is a crucial aspect of meteorology and weather forecasting. Air temperature data provides valuable insights into weather patterns, climate trends, and the formation of various weather systems. By understanding and analyzing air temperatures, meteorologists can make accurate predictions and provide timely information to the public.
The primary instrument used to measure air temperatures is the thermometer, which relies on the principle of thermal expansion or the detection of infrared radiation. Traditional thermometers, such as mercury or alcohol-filled ones, translate temperature changes into the movement of the liquid inside a glass tube. Digital thermometers and infrared thermometers use electronic sensors to measure temperature and provide digital readings.
Recording air temperatures on a weather map involves visual representations such as contour lines, color coding, numerical labels, and weather station symbols. These visual cues allow meteorologists to identify temperature patterns, temperature gradients, and temperature variations across a specific region. By incorporating these representations, meteorologists can effectively communicate temperature data to both fellow scientists and the general public.
Understanding air temperatures on a weather map is essential for analyzing weather conditions, predicting severe weather events, and monitoring climate trends. It provides valuable information for a wide range of applications, including weather forecasting, hydrological forecasting, agriculture, and climate research.
In conclusion, measuring and recording air temperatures on a weather map is a critical component of meteorology. It allows meteorologists to gain insights into weather patterns, make accurate predictions, and provide crucial information for public safety and planning. By continuously advancing temperature measurement techniques and improving the visualization of temperature data, meteorologists strive to enhance our understanding of the complex world of weather and climate.
Frequently Asked Questions about Which Weather Instrument Is Used To Measure Air Temperatures Recorded On A Weather Map?
Was this page helpful?
At Storables.com, we guarantee accurate and reliable information. Our content, validated by Expert Board Contributors, is crafted following stringent Editorial Policies. We're committed to providing you with well-researched, expert-backed insights for all your informational needs.
0 thoughts on “Which Weather Instrument Is Used To Measure Air Temperatures Recorded On A Weather Map?”